

Storytelling with Data
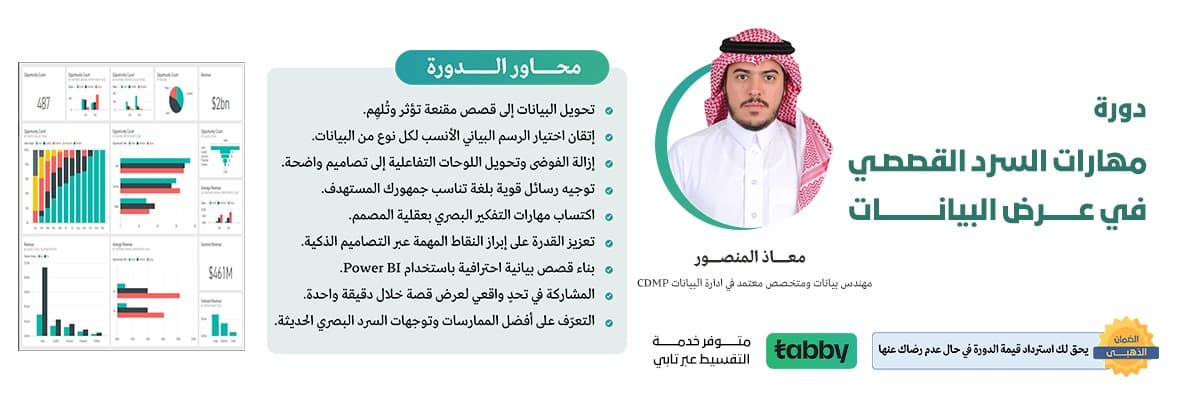
Course Overview
A concise overview of the program.
The "Data Storytelling & Power BI Masterclass" is a practical program designed to bridge the gap between complex data analysis and persuasive communication. You will learn how to breathe life into your data using the latest visualization techniques and interactive dashboard design.
Throughout this course, you will master the science of choosing the right charts, simplifying complex information, and crafting compelling narratives using Microsoft Power BI. This course is specifically tailored for analysts, project managers, and decision-makers who want to elevate their data visualization capabilities and align their reporting with global best practices in Data Storytelling.
Course Content
What you will cover during this program.
🔹 The Narrative Shift: Transforming dry data into engaging stories that influence and inspire action.
🔹 Visual Selection: Mastering the art of choosing the optimal chart type for every data category.
🔹 Decluttering Design: Removing visual noise to create clean, high-impact interactive dashboards.
🔹 Strategic Communication: Crafting powerful messages tailored to your specific target audience.
🔹 Professional Branding: Developing a professional design style that attracts and engages stakeholders.
🔹 Smart Highlighting: Utilizing intelligent design to emphasize critical data points and insights.
🔹 Power BI Foundations: Mastering the essential tools and features of Microsoft Power BI.
🔹 The 1-Minute Challenge: Participating in a real-world challenge to present a concise, accurate story in 60 seconds.
🔹 Global Trends: Identifying the latest best practices and modern trends in visual storytelling.
Course Objectives
What you will achieve by the end of this program.
- 🔹 Actionable Insights: Acquiring the skill to turn complex datasets into attractive visual stories that drive executive decision-making.
- 🔹 Power BI Proficiency: Mastering Power BI to create interactive dashboards that reflect key performance indicators (KPIs) with clarity and professionalism.
- 🔹 Design Optimization: Developing the ability to select the perfect visual layouts to enhance the persuasive power of your message.
- 🔹 Standard Excellence: Learning international best practices in data presentation to make your reports more impactful.
- 🔹 Competitive Edge: Building a unique skill set that distinguishes you in fields like data analysis, project management, and strategic consulting.
Course Overview
A concise overview of the program.
The "Data Storytelling & Power BI Masterclass" is a practical program designed to bridge the gap between complex data analysis and persuasive communication. You will learn how to breathe life into your data using the latest visualization techniques and interactive dashboard design.
Throughout this course, you will master the science of choosing the right charts, simplifying complex information, and crafting compelling narratives using Microsoft Power BI. This course is specifically tailored for analysts, project managers, and decision-makers who want to elevate their data visualization capabilities and align their reporting with global best practices in Data Storytelling.
Course Content
What you will cover during this program.
🔹 The Narrative Shift: Transforming dry data into engaging stories that influence and inspire action.
🔹 Visual Selection: Mastering the art of choosing the optimal chart type for every data category.
🔹 Decluttering Design: Removing visual noise to create clean, high-impact interactive dashboards.
🔹 Strategic Communication: Crafting powerful messages tailored to your specific target audience.
🔹 Professional Branding: Developing a professional design style that attracts and engages stakeholders.
🔹 Smart Highlighting: Utilizing intelligent design to emphasize critical data points and insights.
🔹 Power BI Foundations: Mastering the essential tools and features of Microsoft Power BI.
🔹 The 1-Minute Challenge: Participating in a real-world challenge to present a concise, accurate story in 60 seconds.
🔹 Global Trends: Identifying the latest best practices and modern trends in visual storytelling.
Course Objectives
What you will achieve by the end of this program.
- 🔹 Actionable Insights: Acquiring the skill to turn complex datasets into attractive visual stories that drive executive decision-making.
- 🔹 Power BI Proficiency: Mastering Power BI to create interactive dashboards that reflect key performance indicators (KPIs) with clarity and professionalism.
- 🔹 Design Optimization: Developing the ability to select the perfect visual layouts to enhance the persuasive power of your message.
- 🔹 Standard Excellence: Learning international best practices in data presentation to make your reports more impactful.
- 🔹 Competitive Edge: Building a unique skill set that distinguishes you in fields like data analysis, project management, and strategic consulting.
FAQ
Find answers to the most common questions about our training courses, registration steps, and certification process.
For any additional inquiries, please reach out to us through our available support channels.
هل أحتاج خبرة سابقة في Power BI للالتحاق بالدورة؟
هل سأتعلم كيفية اختيار الرسم البياني الأنسب لعرض البيانات؟
هل الدورة عملية أم نظرية؟
هل سأحصل على ملفات العمل والقوالب بعد الدورة؟
ما الفائدة التي سأحصل عليها إذا كنت أعمل في التسويق أو المبيعات؟
هل سأتعلّم كيف أعرض البيانات لجمهور غير متخصص؟
Target Audience
This program is designed for the following profiles.
- 🔹 Data Analysts: Professionals looking to upgrade their visual narrative and presentation skills.
- 🔹 Project Managers: Leaders who need to present clear, concise reports and interactive dashboards.
- 🔹 Marketing & Sales Specialists: Experts aiming to present statistical data in an engaging and persuasive manner.
- 🔹 Executive Leaders: Decision-makers who rely on data analysis to steer strategic business directions.
- 🔹 Power BI Developers: Dashboard designers wanting to improve the aesthetic and narrative quality of their work.
- 🔹 Researchers & Academics: Individuals who want to present research findings using a professional visual approach.